Halloween candy budgets rose 71% since 2010. Candy prices rose 72%.
Planned candy spending per person celebrating rose from $20 in 2010 to $35 this year. Candy prices rose just as fast, so the bigger budget buys about the same candy.
Candy budget and candy prices since 2010
Change since 2010, September of each year.
| Year | Budget | Change | Candy prices |
|---|---|---|---|
| 2026 | $34.79 | +71% | +72% |
| 2025 | $34.24 | +69% | +60% |
| 2024 | $31.69 | +56% | +46% |
| 2023 | $31.93 | +57% | +45% |
| 2022 | $29.51 | +45% | +35% |
| 2021 | $30.40 | +50% | +19% |
| 2020 | $27.55 | +36% | +17% |
| 2019 | $25.37 | +25% | +14% |
| 2018 | $25.47 | +26% | +9.4% |
| 2017 | $25.27 | +25% | +8.2% |
| 2016 | $24.43 | +20% | +9.7% |
| 2015 | $23.10 | +14% | +10% |
| 2014 | $23.39 | +15% | +5.8% |
| 2013 | $22.37 | +10% | +3.8% |
| 2012 | $23.27 | +15% | +6.2% |
| 2011 | $21.05 | +3.8% | +5.2% |
| 2010 | $20.29 | 0% | 0% |
Each year since 2010: planned candy spending per person, the candy and all-items price indexes for September, and the change since 2010, as a gzipped CSV.
Download CSV (gzip)What a bag costs at Target this week
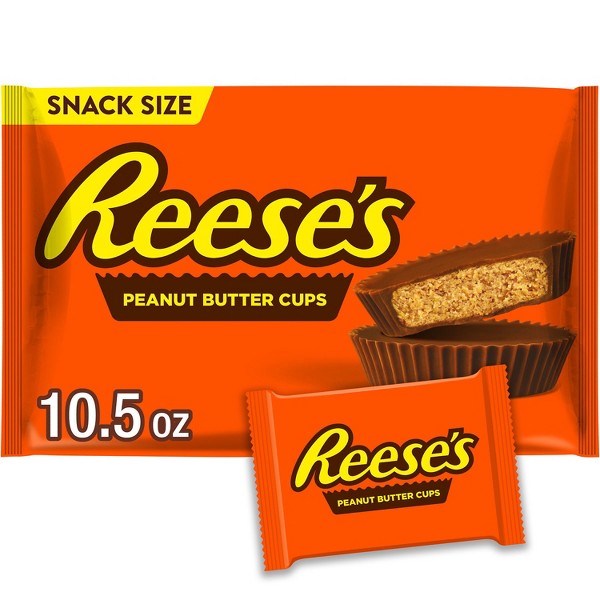
Reese's Cups
$6.29
10.5 oz bag
$3.66 at 2010 candy prices
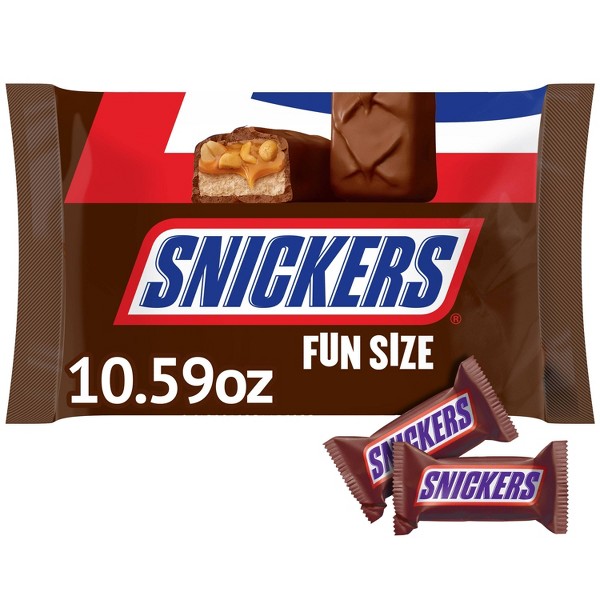
Snickers Fun Size
$6.19
10.6 oz bag
$3.60 at 2010 candy prices
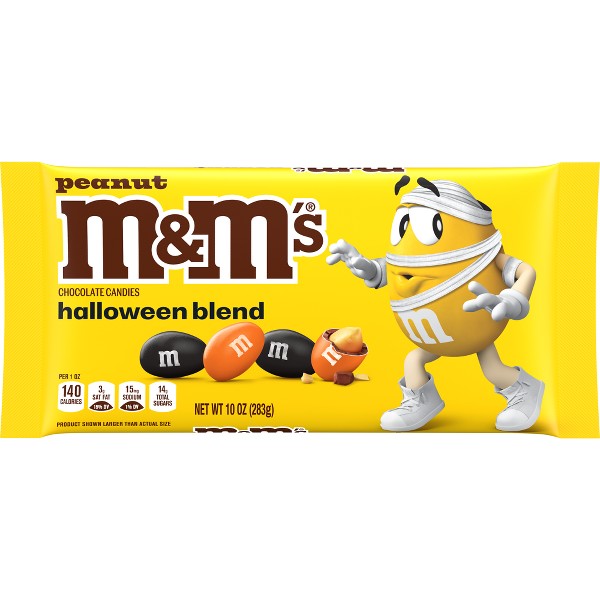
M&M's Peanut
$5.89
10 oz bag
$3.42 at 2010 candy prices
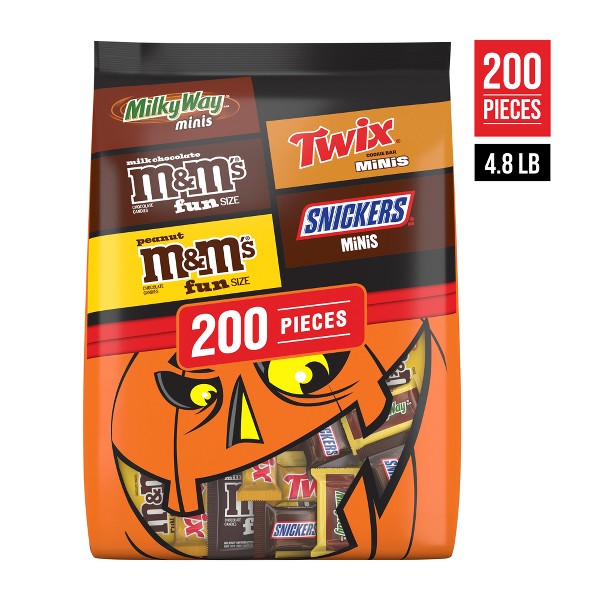
Mars variety bag
$25.99
200 pieces, 13¢ each
$15.11 at 2010 candy prices
| Product | Price | At 2010 prices |
|---|---|---|
| Reese's Cups | $6.29 | $3.66 |
| Snickers Fun Size | $6.19 | $3.60 |
| M&M's Peanut | $5.89 | $3.42 |
| Mars variety bag | $25.99 | $15.11 |
About the data
- Why candy got pricier. Hershey raised prices in 2022, citing sugar, dairy, packaging and labor costs (CNN Business). Then cocoa hit a record of about $12,900 a metric ton in December 2024 (Trading Economics, International Cocoa Organization).
- The NRF figures are what adults celebrating Halloween planned to spend on candy, not what they paid at the till. The 2026 survey asked 7,889 adults from September 1 to 9.
- Candy prices are the BLS consumer price index for candy and chewing gum in September of each year, not seasonally adjusted. BLS counts a smaller pack at the same price as a price rise.
- The 2010 prices on the cards are estimates. Each is today's price divided by the 72% rise in candy prices, not a price anyone recorded in 2010.
- Target prices are national online prices from one day. Store prices and sales can differ.